Converts taxonomic names in one or more columns to plotmath italic
expressions suitable for use in ggplot2 axis labels or legends
via ggplot2::label_parsed. A new column named
<column>_italic is appended to the data frame for each
input column.
Arguments
- data
A data frame.
- columns
Column name or
c()of column names to italicize, supplied either unquoted (SciName) or quoted ("SciName"). Each named column must contain character strings (e.g."Homo sapiens").- drop_na
Logical. If
TRUE, rows withNAin any of the specified columns are dropped before conversion. Default isFALSE.
Value
The input data frame with one additional character column appended per
entry in columns, named <column>_italic. Each new column
contains a plotmath expression of the form "italic(Genus~species)",
where spaces are replaced with ~ to preserve word spacing when
rendered. NA values in the source column remain NA in the
output column when drop_na = FALSE.
Details
The _italic columns are intended to be mapped to a ggplot2
aesthetic (e.g. aes(x = Species_italic)) and rendered as parsed
expressions by passing label_parsed to the
labels argument of the corresponding scale. This keeps names as
plain character data until the plot is rendered, avoiding manual
expression() calls.
Authorship strings appended by taxon_cite in the format
"Genus species (Author, Year)" are automatically detected and
rendered in roman type alongside the italic canonical name, producing
expressions of the form italic("Genus species")~"(Author, Year)".
Spaces in names are replaced with ~ prior to wrapping in
italic(), which is required for plotmath to render multi-word
names (e.g. genus + species) correctly.
See also
taxon_cleaner for standardising taxonomic name formatting
before italicising,
taxon_combine for merging genus and epithet into a binomial
name before italicising,
taxon_validate for validating taxonomic names before
italicising,
taxon_spellcheck for correcting misspellings before
italicising,
taxon_cite for appending authorship in the format detected
and rendered by this function,
label_parsed for rendering plotmath expressions in
ggplot2 scales.
Examples
df <- data.frame(
SciName = c("Homo sapiens", "Panthera leo", "Canis lupus"),
count = c(120, 45, 78)
)
# Italicize a single column
df <- italicize(df, SciName)
df$SciName_italic
#> [1] "italic(\"Homo sapiens\")" "italic(\"Panthera leo\")"
#> [3] "italic(\"Canis lupus\")"
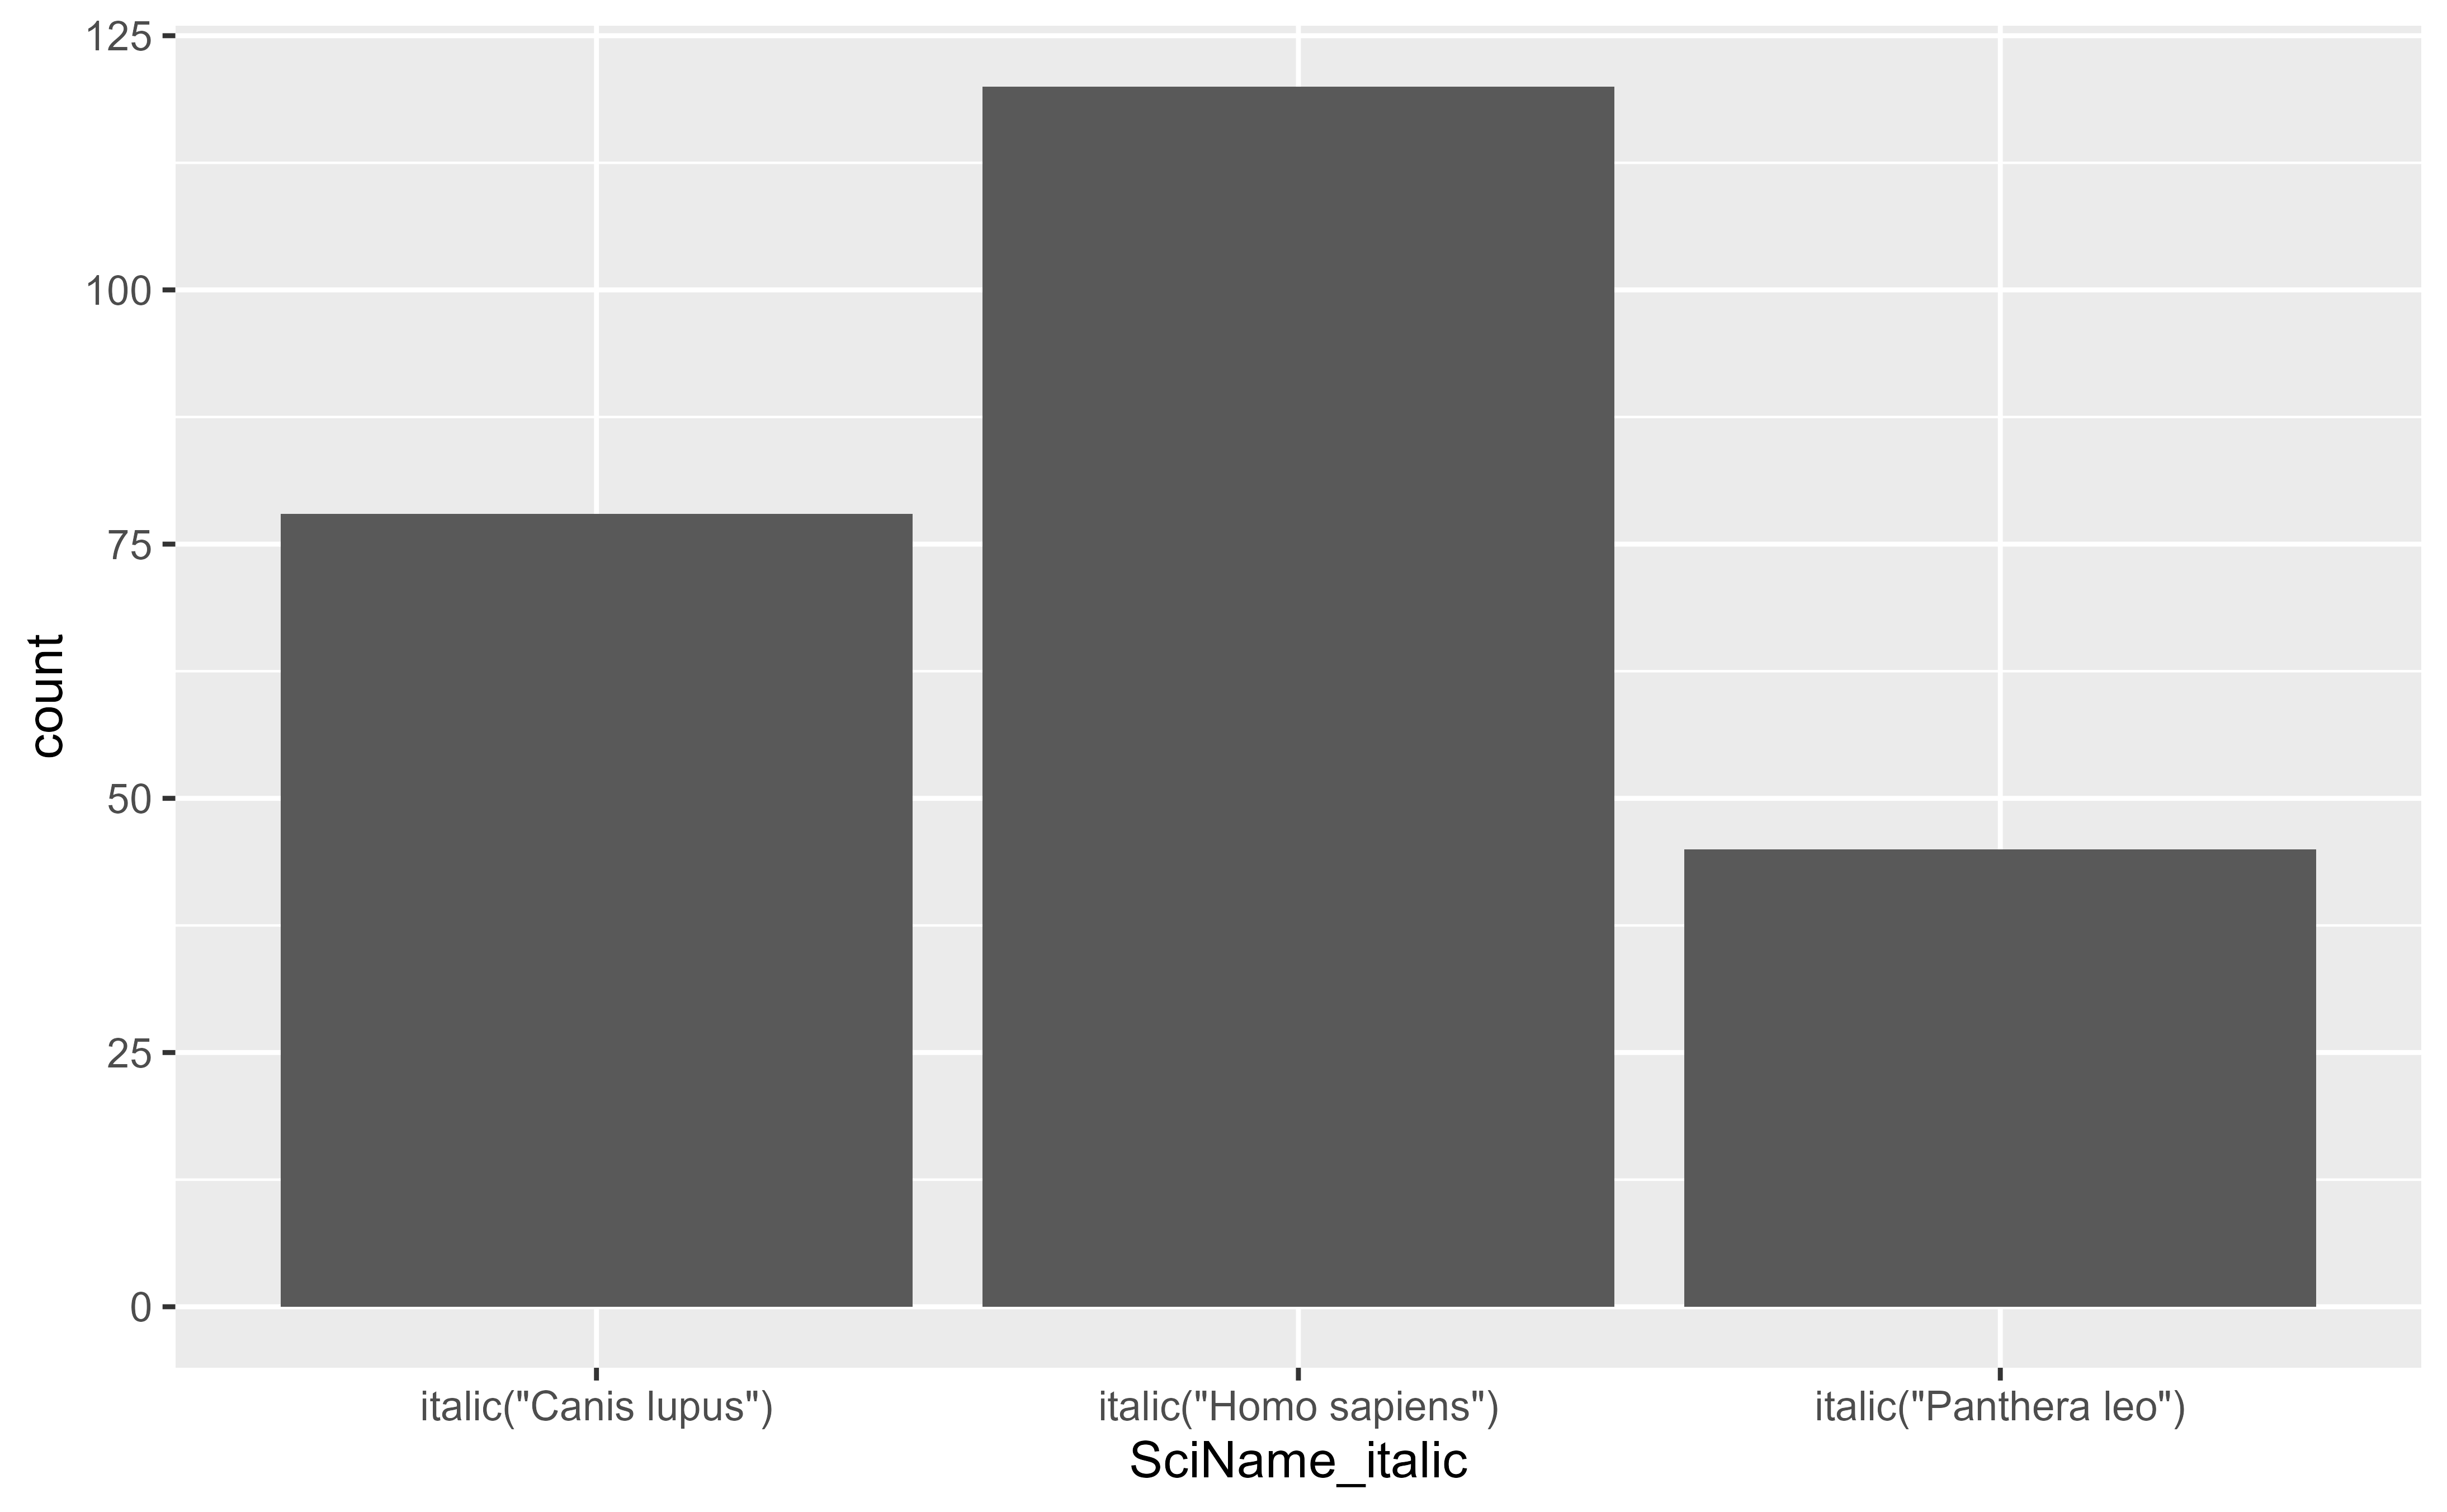
# Use in a ggplot2 axis with parsed labels
# \donttest{
if (requireNamespace("ggplot2", quietly = TRUE)) {
ggplot2::ggplot(df, ggplot2::aes(x = SciName_italic, y = count)) +
ggplot2::geom_col() +
ggplot2::scale_x_discrete(labels = ggplot2::label_parsed)
}
 # }
# Italicize multiple columns at once
df2 <- data.frame(
genus = c("Homo", "Panthera"),
species = c("sapiens", "leo")
)
italicize(df2, c(genus, species))
#> genus species genus_italic species_italic
#> 1 Homo sapiens italic("Homo") italic("sapiens")
#> 2 Panthera leo italic("Panthera") italic("leo")
# Drop rows where the name column is NA
df_na <- data.frame(
SciName = c("Homo sapiens", NA, "Canis lupus"),
count = c(10, 5, 8)
)
italicize(df_na, SciName, drop_na = TRUE)
#> SciName count SciName_italic
#> 1 Homo sapiens 10 italic("Homo sapiens")
#> 3 Canis lupus 8 italic("Canis lupus")
# }
# Italicize multiple columns at once
df2 <- data.frame(
genus = c("Homo", "Panthera"),
species = c("sapiens", "leo")
)
italicize(df2, c(genus, species))
#> genus species genus_italic species_italic
#> 1 Homo sapiens italic("Homo") italic("sapiens")
#> 2 Panthera leo italic("Panthera") italic("leo")
# Drop rows where the name column is NA
df_na <- data.frame(
SciName = c("Homo sapiens", NA, "Canis lupus"),
count = c(10, 5, 8)
)
italicize(df_na, SciName, drop_na = TRUE)
#> SciName count SciName_italic
#> 1 Homo sapiens 10 italic("Homo sapiens")
#> 3 Canis lupus 8 italic("Canis lupus")